文献信息
Mallet et al., arXiv:1005.3436 (2010),“Single-shot qubit readout in circuit Quantum Electrodynamics”. arXiv:1005.3436 · DOI:10.1038/nphys1400 原文为 arXiv 预印本版本的机器可读转换,公式与图注以原文为准;本页仅作站内索引与全文查阅,引用请以正式出版物为准。
全文
Single-shot qubit readout in circuit Quantum Electrodynamics
François Mallet, Florian R. Ong, Agustin Palacios-Laloy, François
Nguyen, Patrice Bertet, Denis Vion* and Daniel Esteve
1Quantronics group, Service de Physique de l’État Condensé (CNRS URA 2464),
DSM/IRAMIS/SPEC, CEA-Saclay,
91191 Gif-sur-Yvette Cedex, France∗
The future development of quantum information using superconducting circuits requires Josephson qubits [1] with long coherence times combined to a high-fidelity readout. Major progress in the control of coherence has recently been achieved using circuit quantum electrodynamics (cQED) architectures [2, 3], where the qubit is embedded in a coplanar waveguide resonator (CPWR) which both provides a well controlled electromagnetic environment and serves as qubit readout. In particular a new qubit design, the transmon, yields reproducibly long coherence times [4, 5]. However, a high-fidelity single-shot readout of the transmon, highly desirable for running simple quantum algorithms or measuring quantum correlations in multi-qubit experiments, is still lacking. In this work, we demonstrate a new transmon circuit where the CPWR is turned into a sample-and-hold detector, namely a Josephson Bifurcation Amplifer (JBA) [6, 7], which allows both fast measurement and single-shot discrimination of the qubit states. We report Rabi oscillations with a high visibility of together with dephasing and relaxation times longer than 0.5 µs. By performing two subsequent measurements, we also demonstrate that this new readout does not induce extra qubit relaxation.
A common strategy to readout a qubit consists in coupling it dispersively to a resonator, so that the qubit states and shift differently the resonance frequency. This frequency change can be detected by measuring the phase of a microwave pulse reflected on (or transmitted through) the resonator. Such a method, successfully demonstrated with a Cooper pair box capacitively coupled to a CPWR [2, 3], faces two related difficulties which have prevented so far from measuring the qubit state in a single readout pulse (so-called singleshot regime): the readout has to be completed in a time much shorter than the time in which the qubit relaxes from to , and with a power low enough to avoid spurious qubit transitions [8].
This issue can be solved by using a sample-and-hold detector consisting of a bistable hysteretic system whose two states are brought in correspondence with the two qubit states. Such a strategy has been implemented in various qubit readouts [9, 10]. In our experiment the bistable system is a Josephson Bifurcation Amplifier (JBA) [6, 7] obtained by inserting a Josephson junction in the middle of the CPWR (see Fig. 1). When driven by a microwave signal of properly chosen frequency and power, this non-linear resonator can
bifurcate between two dynamical states and with different intra-cavity field amplitudes and reflected phases. In order to exploit the hysteretic character of this process, we perform the readout in two steps (see Fig. 1a): the qubit state or is first mapped onto or in a time much shorter than ; the selected resonator state is then hold by reducing the measuring power during a time long enough to determine this stateQ with certainty.
JBAs were used previously to readout quantroniums [11–13] and flux-qubits, obtaining for the latter fidelities up to 87% [14] with Quantum-Non-Demolition character [15]. Here we couple capacitively a transmon to a JBA, combining all the advantages of the cQED architecture (long coherence times, scalability) with the single-shot capability of a sampleand-hold detector. A crucial characteristic of this new design is its very low back-action during readout. Indeed the qubit frequency depends only on the slowly-varying photon number inside the resonator [16], yielding less relaxation than in previous experiments where the qubit was coupled to a rapidly varying variable of the JBA (the intra-resonator current). Furthermore we designed the resonator to make it bifurcate at a low photon number, thus avoiding unwanted qubit state transitions during readout.
The complete setup is shown in Fig. 1: the transmon [4, 5] of frequency tunable with a magnetic flux is coupled with a coupling constant MHz to the non-linear CPWR of fundamental frequency , quality factor and Josephson junction critical current . In this work the qubit is operated at positive detunings larger than . In this dispersive regime the resonator frequency depends on the qubit state , and the difference (so-called cavity pull) is a decreasing function of . Readout pulses (Fig. 1a) of frequency and maximum power are sent to the circuit; after reflection on the resonator their two quadratures and are measured by homodyne detection. They belong to two clearly resolved families of trajectories (Fig. 1b) corresponding to both oscillator states and . The escape from to is a stochastic process activated by thermal and quantum noise in the resonator [17, 18], and occurs during the sampling time with a probability that increases with . The position of the so-called “S-curve” depends on the detuning [6] and thus on the qubit state. When the two S-curves and corresponding to and are sufficiently separated, one can choose a value of at which these states are well mapped onto and (Fig. 1c).
We now present our best visibity, obtained at GHz in this work and confirmed
on another sample. We measure and (Fig. 2) after preparing the transmon in state or using a resonant microwave pulse. The contrast, defined as the maximum difference between both curves, reaches 86%. To interpret the power separation between the S-curves, we search the readout frequency that makes coincide with at low bifurcation probability. This indirect determination of the cavity pull gives , in good agreement with the value MHz calculated from the experimental parameters. At high however the two S-curves do not coincide, which reveals that the limiting factor of our readout fidelity is relaxation of the qubit before the time needed for the resonator to reach its final state. To reduce this effect and improve the readout contrast, we transfer state into the next excited state 2 with a resonant pulse just before the readout pulse, yielding the S-curve and a 92% contrast. This technique, already used with other Josephson qubits [10], is analogous to electron shelving in atomic physics and relies here on the very low decay rate from to in the transmon. Figure 2b shows Rabi oscillations between and obtained with such a composite readout pulse. The visibility, defined as the fitted amplitude of the oscillations, is 94%, and the Rabi decay time is 0.5 µs. Of the remaining 6% loss of visibility we estimate that about 4% is due to relaxation before bifurcation and 2% to residual out-of-equilibrium population of and to control pulse imperfections. Such a visibility higher than 90% is in agreement with the width of the Scurves estimated from numerical simulations, with their theoretical displacement, and with the measured qubit relaxation time.
The visibility being limited by relaxation, it is important to determine whether the readout process itself increases the qubit relaxation rate. For that purpose we compare (at Hz) Rabi oscillations obtained with two different protocols: the control pulse is either followed by two successive readout pulses yielding curves and , or by only the second readout pulse yielding curve (see Fig. 3a). and exhibit almost the same loss of visibility compared to , indicating that relaxation in the presence of the first readout pulse is the same as (and even slightly lower than) in its absence.
To further investigate this remarkable effect, we measure in presence of a microwave field at the same frequency as during readout, and for different input powers (see Fig. 3b). We first roughly estimate the intra-cavity mean photon number by measuring the AC-Stark shifted qubit frequency [16] (the correpondence is obtained by a numerical diagonalization of the Hamiltonian of the transmon coupled to a field mode with
photons). Bifurcation is clearly revealed by a sudden jump of from about 5-10 to 50-100 photons. Meanwhile does not show any decrease up to about above bifurcation. It even slightly increases because the qubit frequency is pushed away from the cavity, slowing down spontaneous emission as explained in the next paragraph. This is in strong contrast with all previous experiments using a JBA readout [18, 19]. These results prove that our design achieves very low back-action on the qubit. A similar behavior was observed for most qubit frequencies, except at certain values of and where dips in were occasionally observed above bifurcation.
We now discuss the dependence of the readout contrast and qubit coherence on the detuning . Besides acting as a qubit state detector, the resonator serves also as a filter protecting the qubit against spontaneous emission into the 50 impedance of the external circuit [20, 21]. The smaller , the stronger the coupling between the qubit and the resonator, implying a larger separation between the and curves but also a faster relaxation. We thus expect the contrast to be limited by relaxation at small , by the poor separation between the S-curves at large , and to exhibit a maximum in between. Figure 4 presents a summary of our measurements of contrast and coherence times. At small , is in quantitative agreement with calculations of the spontaneous emission trough the resonator. However it presents a saturation, similarly as observed in previous experiments [20], but at a smaller value around 0.7 µs. The effective cavity pull determined from the S-curves shifts (cf. Fig. 2) is in quantitative agreement with the value of calculated from the sample parameters. The contrast varies with as anticipated and shows a maximum of 92% at GHz, where µs. Larger can be obtained at the expense of a lower contrast and reciprocally. Another important figure of merit is the pure dephasing time [23] which controls the lifetime of a superposition of qubit states. is extracted from Ramsey fringes experiments (see Methods), and shows a smooth dependence on the qubit frequency, in qualitative agreement with the dephasing time deduced from a flux noise of spectral density set to at , a value similar to those reported elsewhere [24]. To summarize our circuit performances, we obtained a 400 MHz frequency range (pink area on Fig. 4) where the readout contrast is higher than 85%, is between 0.7 µs and 0.3 µs, and between 0.7 µs and 1.5 µs. Further optimization of the JBA parameters and could increase this high-visibility readout frequency window.
In conclusion we have demonstrated the high-fidelity single-shot readout of a transmon
qubit in a circuit-QED architecture using a bifurcation amplifier. This readout does not induce extra qubit relaxation and preserves the good coherence properties of the transmon. The high fidelity achieved should allow a test of Bell’s inequalities using two coupled transmons, each one with its own JBA single-shot readout. Moreover, our method could be used in a scalable quantum processor architecture, in which several transmon-JBAs with staggered frequencies are read by frequency multiplexing.
Methods
A. Sample fabrication
The sample was fabricated using standard lithography techniques. In a first step, a 120 nm-thick niobium film is sputtered on an oxidized high-resistivity silicon chip. It is patterned by optical lithography and reactive ion etching of the niobium to form the coplanar waveguide resonator. The transmon and the Josephson junction of the CJBA are then patterned by e-beam lithography and double-angle evaporation of two aluminum thin-films, the first one being oxidized to form the junction tunnel barrier. The chip is glued on and wire-bonded to a microwave printed-circuit board enclosed in a copper box, which is thermally anchored to the mixing chamber of a dilution refrigerator at typically .
B. Electrical lines and signals
Qubit control and readout microwave pulses are generated by mixing the output of a microwave source with “DC” pulses generated by arbitrary waveform generators, using DC coupled mixers. They are then sent to the input microwave line that includes bandpass filters and attenuators at various temperatures. The powers given in dB in this letter are arbitrarily refered to 1 mW (on ) at the input of the dilution refrigerator; the total attenuation down to the sample is about . The pulses are routed to the resonator through a circulator to separate the input and output waves.
The readout output line includes a bandpass filter ( GHz), 2 isolators, and a cryogenic amplifier (CITCRYO 1-12 from California Institute for Technology) with 38 dB gain and noise temperature . The output signal is further amplified at room-temperature with a total gain of 56 dB, and finally mixed down using an I/Q mixer with a synchronized
local oscillator at the same frequency. The and quadratures are further amplified by , and sampled by a fast digitizer. The data are then transferred to a computer and processed. The single-shot traces of Fig. 1b. were obtained with an additional 10 MHz low-pass filter.
C. Sample characterization
The characteristic energies of the system, namely the transmon Josephson energy 21 GHz and charging energy GHz (for a Cooper-pair), as well as the qubit-resonator coupling constant , have been determined by spectroscopic measurements. The bare resonator frequency was determined at a magnetic field such that the qubit was far detuned from the resonator.
D. Qubit state preparation
We prepare the qubit in its ground state with a high fidelity at the beginning of each experimental sequence by letting it relax during about 20µs. We estimate at about the equilibrium population in state due to residual noise coming from measurement lines.
To prepare the qubit in its excited state or , one or two successive resonant squareshaped pulses of length ns are applied prior to the readout pulse. The dotted blue S-curve of Fig. 1 was recorded with a single resonant pulse at (see text): it reveals that this pulse induces a spurious population of the state of order 1%. We checked that this effect is corrected by using gaussian-shaped pulses [9] (data not shown).
E. Readout Pulses
We give here more information on the timing of the readout pulses used is this work. In Fig. 2, readout is performed at , and we used , and . We stress that although is of the same order of magnitude as , the observed relaxation-induced loss of contrast is rather low, which may seem surprising. This is due to an interesting property of our readout : when the qubit is in state , the JBA bifurcates with a high probability, implying that all bifurcation events occur at the very
beginning of the readout pulse (instead of being distributed exponentially during ). We nevertheless keep because the bifurcation process itself needs such a duration to develop properly. The effective measurement time is thus shorter than . We verified that weighted sums of and fit properly the curves (i=1,2) of Fig. 2, allowing us to quantify the population of each level at readout. Using the experimentally determined relaxation times s and µs, we thus estimate .
In Fig. 3, readout is performed at , to reduce the total measurement duration. Indeed, as a larger readout detuning implies a higher driving power and thus a higher reflected power, the signal to noise ratio is increased which allows to shorten to 50 ns. We also used for these data and to shorten the overall measurement time, which also decreases the maximal contrast to approx 83%. Finally, a delay time of 120 ns between the two readout pulses has been optimized experimentally to empty the resonator of all photons due to the first measurement, and thus avoid any spurious correlations between the two outcomes of the sequence.
F. Coherence times measurement
The qubit coherence times are measured using standard experimental sequences [22]. For the relaxation time , we apply a pulse and measure the qubit state after a variable delay, yielding an exponentially decaying curve whose time constant is . The coherence time is obtained by a Ramsey experiment: two pulses are applied at a frequency slightly off-resonance with the qubit and with a variable delay; this yields an exponentially damped oscillation whose time constant is . We then extract the pure dephasing contribution to the quantum coherence (as well as the associated maximum uncertainty) using the relation [23].
Acknowledgments
We acknowlege financial support from European projects EuroSQIP and Midas, from ANR-08-BLAN-0074-01, and from Region Ile-de-France for the nanofabrication facility at SPEC. We gratefully thank P. Senat and P. Orfila for technical support, and acknowledge useful discussions within the Quantronics group and with A. Lupascu, I. Siddiqi, M. Devoret
and A. Blais.
Author contributions: F.M., P.B., D.V. & D.E. designed the experiment, F.O. fabricated the sample, F.M., F.N., A.P.L, F.O. & P.B. performed the measurements, and all the authors contributed to the writing of the manuscript.
Correspondance should be addressed to D.V.
[1] Wendin, G. & Shumeiko, V.S., Superconducting Quantum Circuits, Qubits and Computing, in Handbook of Theoretical and Computational Nanotechnology, edited by M. Rieth and W. Schommers (American scientific, California, 2006), Vol. 3., available online on condmat/0508729 (2005).
[2] Blais, A. Huang, R., Wallraff, A., Girvin, S. M., & Schoelkopf, R. J., Cavity quantum electrodynamics for superconducting electrical circuits: An architecture for quantum computation, Phys. Rev. A 69, 062320 (2004).
[3] Wallraff, A. et al., Strong coupling of a single photon to a superconducting qubit using circuit quantum electrodynamics, Nature 431, 162-167 (2004).
[4] Koch, J. et al., Charge-insensitive qubit design derived from the Cooper pair box, Phys. Rev. A 76, 042319 (2007).
[5] Schreier, J. A. et al., Suppressing charge noise decoherence in superconducting charge qubits, Phys. Rev. B 77, 180502 (2008).
[6] Siddiqi, I. et al., RF-Driven Josephson Bifurcation Amplifier for Quantum Measurement, Phys. Rev. Lett. 93, 207002 (2004).
[7] Boaknin, E. et al., Dispersive microwave bifurcation of a superconducting resonator cavity incorporating a Josephson junction, arXiv:cond-mat/0702445 (unpublished).
[8] Boissonneault, M., Gambetta, J. M. & Blais, A. Nonlinear dispersive regime of cavity QED: The dressed dephasing model. Phys. Rev. A 77, 060305 (2008).
[9] Lucero, E. et al., High-Fidelity Gates in a Single Josephson Qubit, Phys. Rev. Lett. 100, 247001 (2008).
[10] Martinis, J.M., Nam, S., Aumentado, J., & Urbina, C., Rabi Oscillations in a Large Josephson-Junction Qubit, Phys. Rev. Lett. 89, 117901 (2002).
[11] Siddiqi, I. et al., Dispersive measurements of superconducting qubit coherence with a fast latching readout, Phys. Rev. B 73, 054510 (2006).
[12] Boulant, N. et al., Quantum nondemolition readout using a Josephson bifurcation amplifier, Phys. Rev. B 76, 014525 (2007).
[13] Metcalfe, M. et al., Measuring the decoherence of a quantronium qubit with the cavity bifurcation amplifier, Phys. Rev. B 76, 174516 (2007).
[14] Lupascu, A., Driessen, E. F. C., Roschier, L., Harmans, C. J. P. M. A. & Mooij, J. E., High-Contrast Dispersive Readout of a Superconducting Flux Qubit Using a Nonlinear Resonator, Phys. Rev. Lett. 96, 127003 (2006).
[15] Lupascu, A. et al., Quantum non-demolition measurement of a superconducting two-level system, Nature Phys. 3, 119-125 (2007).
[16] Schuster, D. I. et al., ac Stark Shift and Dephasing of a Superconducting Qubit Strongly Coupled to a Cavity Field, Phys. Rev. Lett. 94, 123602 (2004).
[17] Dykman, M. I. & Krivoglaz, M. A., Fluctuations in nonlinear systems near bifurcations corresponding to the appearance of new stable states. Physica A 104, 480-494 (1980).
[18] Vijayaraghavan, R., PhD thesis (2008), available online at http://www.qlab.eng.yale.edu.
[19] Picot, T., Lupascu, A., Saito, S., Harmans, C. J. P. M., & Mooij, J. E.,. Role of relaxation in the quantum measurement of a superconducting qubit using a nonlinear oscillator. Phys. Rev. B 78, 132508 (2008).
[20] Houck, A. A. et al., Controlling the Spontaneous Emission of a Superconducting Transmon Qubit, Phys. Rev. Lett. 101, 080502 (2008).
[21] Esteve, D., Devoret, M. H. & Martinis, J., Effect of an arbitrary dissipative circuit on the quantum energy levels and tunneling of a Josephson junction , Phys. Rev. B 34, 158-163 (1986).
[22] Vion, D. et al., Manipulating the Quantum State of an Electrical Circuit, Science 296, 886-889 (2002).
[23] Ithier, G. et al., Decoherence in a superconducting quantum bit circuit, Phys. Rev. B 72, 134519 (2005).
[24] F. C. Wellstood et al., Low-frequency noise in dc superconducting quantum interference devices below 1 K, Appl. Phys. Lett. 50, 772-774 (1987).
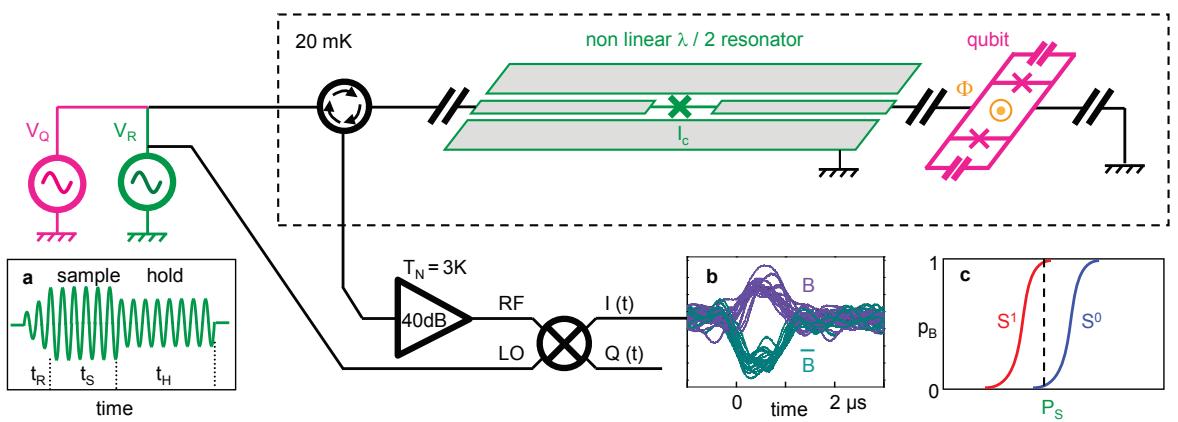
Figure 1: Principle of a single-shot readout for a transmon qubit. A transmon (magenta) is capacitively coupled to a coplanar resonator (green grayed strips) made anharmonic by inserting a Josephson junction (green cross) at its center. This qubit is coherently driven by a source and measured by operating the resonator as a cavity JBA: a microwave pulse with properly adjusted frequency and time dependent amplitude (rise, sampling, and holding times , tS, and , respectively - see inset a and Methods) is applied by a second source ; this pulse is reflected by the system and routed to a cryogenic amplifier and to a homodyne detection circuit yielding the two quadratures and . During the “sampling” time the electromagnetic field in the resonator has a probability to bifurcate from a low amplitude state to a high amplitude one , both states corresponding to different amplitudes of and . The “holding” time is then used to average and to determine with certainty if the resonator has bifurcated or not. (b) Oscillogram showing filtered traces of both types (obtained here with and ). (c) The probability depends on and on the sampling power . The two qubit states and shift the resonator frequency, resulting in two displaced S-curves and . When their separation is large enough, can be chosen (vertical dotted line) so that and map and with a high fidelity.
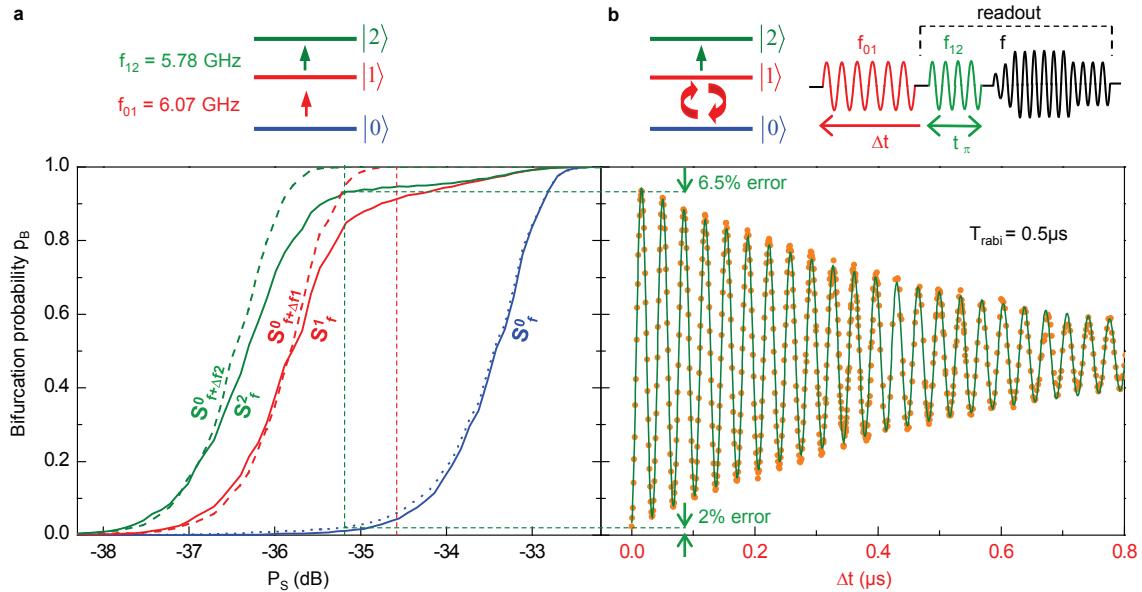
Figure 2: Best single-shot visibity obtained at and . (a)
S-curves obtained with the qubit prepared in state , , or (solid lines , and , respectively) with the proper resonant pulses (top diagram). The maximum differences between and (red vertical line) and between the and (green vertical line) define two readout contrasts of 86% and 92%. The readout fidelity is thus increased by using a composite readout where the measurement pulse is preceded by a pulse at frequency that transfers to . The dotted blue curve obtained after a single pulse at frequency , starting from , shows that this technique has almost no effect on . Also plotted are the curves obtained for when shifting the readout frequency by MHz (red dashed line) and MHz (green dashed line) in order to match at low the curves obtained for and . The difference between the corresponding solid and dashed curves is a loss of visibility mostly due to qubit relaxation before bifurcation. (b) Rabi oscillations at 29 MHz measured with the composite readout, as sketched on top. Dots are experimental values of whereas the solid line is a fit by an exponentially damped sine curve with a 0.5 µs decay time and an amplitude of 94% (best visibility). The total errors in the preparation and readout of the and states are 2% and 6.5% respectively.
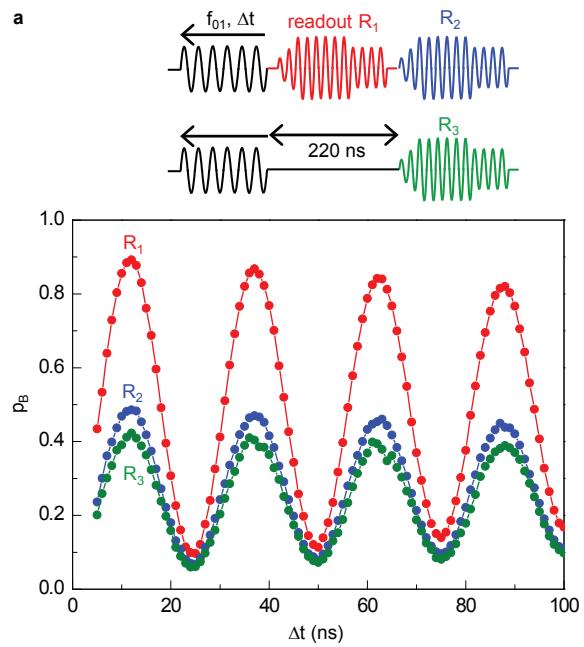
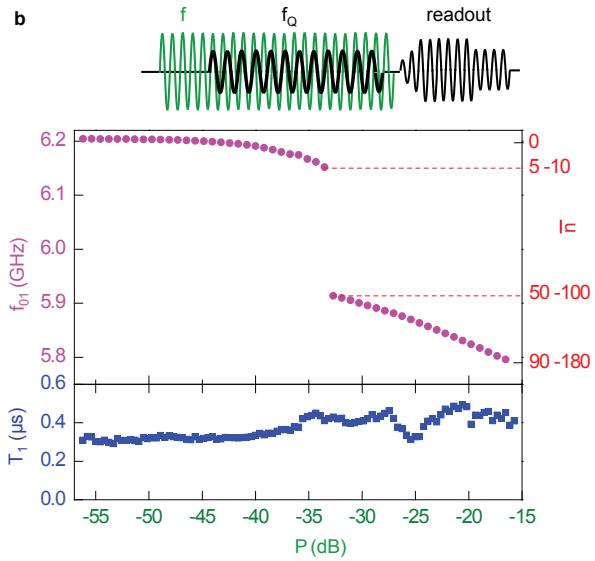
Figure 3: Effect of the readout process onto the qubit at ∆ = 0.25 GHz and fC − f = 25 MHz. (a) Rabi oscillations obtained at with the protocols sketched on top, i.e. with two successive readout pulses placed immediately after the control Rabi pulse (red and blue dots), or with the second pulse only (green dots). The loss of Rabi visibility between the red curve (83 ) and the blue (44%) and green (37%) ones is due to qubit relaxation during the first readout or the delay. (b) Top panel: Spectroscopic determination of the qubit frequency when it is AC-Stark shifted by an auxiliary microwave with frequency and power (protocol on top). The shift provides an in-situ estimate of the average photon number in the resonator (right scale) with a precision of . The bifurcation is seen as a sudden jump. Bottom panel: qubit relaxation time (measurement protocol not shown) in presence of the same auxiliary field. does not show any strong decrease even at power well above bif 13 urcation.
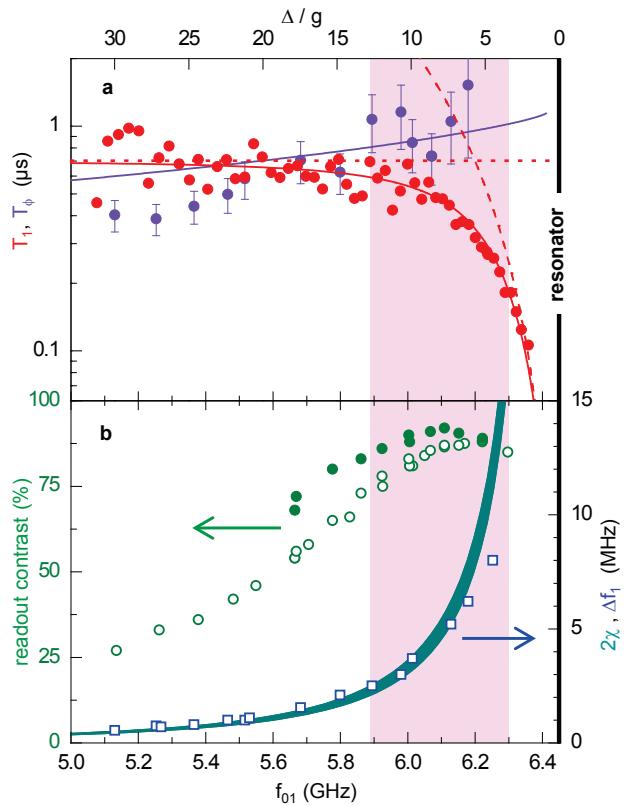
Figure 4: Trade-off between qubit coherence and readout fidelity. (a) Experimental relaxation time (red dots) and dephasing time (violet dots) of the qubit as a function of (or equivalently ). Note that µs at the flux optimal point [22] ( GHz, data not shown). Error bars on are absolute minima and maxima resulting from the maximum experimental uncertainties on the coherence times and (see methods). The solid red line is the value of obtained by adding to the expected spontaneous emission through the resonator (dashed red line) a relaxation channel of unknown origin with (horizontal dotted line). The blue line is the pure dephasing time corresponding to a flux noise with an amplitude set to at . (b - left scale) Readout contrast with (green dots) and without (green circles) transfer from state to (see Fig. 2). (b - right scale) Effective cavity pull (blue squares) determined as shown in Fig. 2. For the sake of comparison, the predicted cavity pull in the dispersive approximation is also shown as a cyan region, taking into account the maximal experimental uncertainty on . The pink area denotes the region where the readout contrast is higher than 85%.